


Azure Application Insights - How not to burn money using it
A different look at a popular (and useful) Azure service.


As Developers, we tend to take things for granted. Especially when it comes to Cloud Services. They make everything seem so easy, you'd be forgiven for taking things for granted. In this blog post, I'm going to talk about Azure Application Insights and how I learned not to take certain things for granted — the hard way.
Disclaimer: I'm only going to be talking about monitoring Azure Functions, specifically using Node.js. I can't say much about monitoring VMs or other services.
What is Azure Application Insights?
In Microsofts own words:
Application Insights, a feature of Azure Monitor, is an extensible Application Performance Management (APM) service for developers and DevOps professionals.
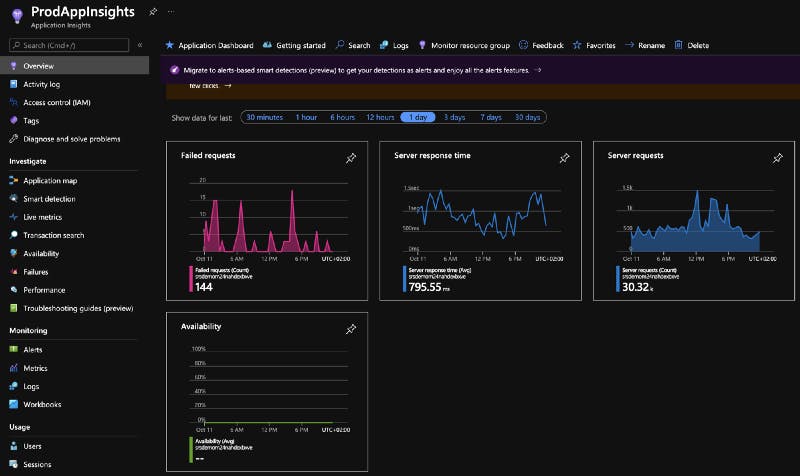
It basically allows you to monitor your applications during and after development for performance, exceptions and a lot of other things. It also stores the data, allows you to run queries over the data and get alerts.
If you're interested, definitely check out the Microsoft Docs to learn more!
How do costs arise from Application Insights?
Like with most Cloud Services, the costs for Application Insights come from the data that's ingested and stored. In the Azure Portal, Microsoft says that for every ingested Gigabyte of data they charge 1.94€ (or ~2.24$). That's not cheap! If your app generates a Gigabyte of data per day (which isn't unrealistic if you get a lot of traffic), that would set you back 60€ (or ~69.33$). Per month 😱 60€ per month and we haven't even brought value to our users yet.
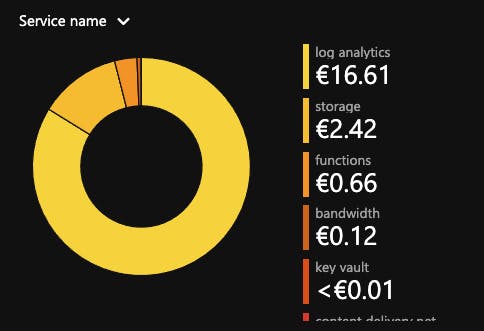
For September 2021, Application Insights (aka Log Analytics) made up over 80% of the total cost of my app. Running my app like this is not profitable at all.
Let's see how this came to be.
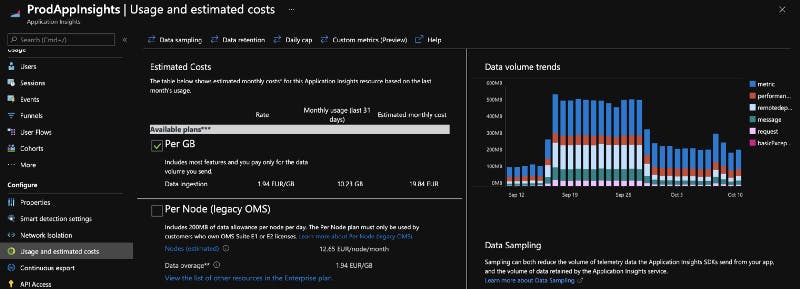
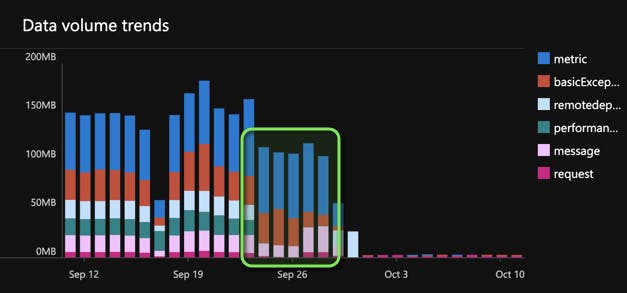
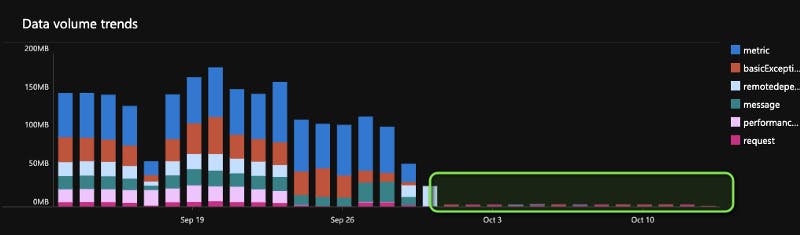
In the image above, you can see the cost overview for Application Insights of an app I developed. The chart on the right shows how much data was ingested on any given day. It also shows how much data of each type was ingested. remoteDependency and metric are the largest. remoteDependency metrics get collected when you access other Azure services, in this case it's a Storage Account. Unfortunately, I'm still unsure what falls under metric .
You can also see the sudden explosion of ingested data (from 100 MB per day to over 500 MB). On those days, the requests per day jumped from 13.000 to over 80.000 🤯 That increase didn't come from a bug in our code but because actual usage of the app increased.
I felt kind of helpless. The Azure Portal doesn't provide any obvious way to change what gets ingested into Application Insights. So, let's look at our options.
How to reduce Application Insights costs
There are a couple of ways to reduce the costs, some work well others not so well. We're going to look at them regardless.
Option #1: Using host.json (okay-ish)
This option is also known as "Codeless monitoring" or "Agent-based monitoring". Basically, you let the Function Runtime (the Agent) do its magic. This option has the least flexibility in my opinion.
Every Azure Function App has a host.json file. The host.json file contains settings that affect all Functions in an Azure Function App (see Microsoft Docs). It has some options regarding Application Insights.
The most notable ones being:
logging.applicationInsights.samplingSettingslogging.logLevel
So I ended up with a host.json that looked something like this
{
  "version": "2.0",
  "logging": {
    "applicationInsights": {
      "samplingSettings": {
        "isEnabled": true,
        "excludedTypes": "Request",
        "enableLiveMetrics": false,
        "enableDependencyTracking": false,
        "enablePerformanceCountersCollection": false
      }
    },
    "logLevel": {
      "default": "Information",
      "Host.Results": "Error",
      "Function": "Error",
      "Host.Aggregator": "Information"
    }
  },
  "extensionBundle": {
    "id": "Microsoft.Azure.Functions.ExtensionBundle",
    "version": "[1.*, 2.0.0)"
  }
}
What did I do?
- I disabled Live Metrics (which are actually free but I don't use them), Dependency Tracking and Performance Counters
- I set Log Levels
- I didn't mess with any of the sampling settings (I didn't have a lot of time playing with the settings and also because of this article).
What drawbacks does this have?
TL;DR: The reduction of costs wasn't that great.
The largest chunk of data was still metric. At least the performance and remoteDependency metrics got disabled. Also, setting the Log Level for Function to "Error" causes only failed requests to show up within Application Insights, so you won't actually know how many requests are made.
Option #2: Application Insights SDK (great)
This option is also known as "Code-based monitoring". You use the Application Insights SDK manually in your Azure Functions (or any other code for that matter). This gives us maximum flexibility but comes with a few code changes.
Step 1: Disable Agent-based monitoring
If you've enabled Agent-based monitoring, you have to disable it manually (either in the Azure Portal or in your Infrastructure-as-Code). To do that, you have to rename (or remove if you don't want to use it at all) the APPINSIGHTS_INSTRUMENTATIONKEY App Settings in the Configuration section of your Function App
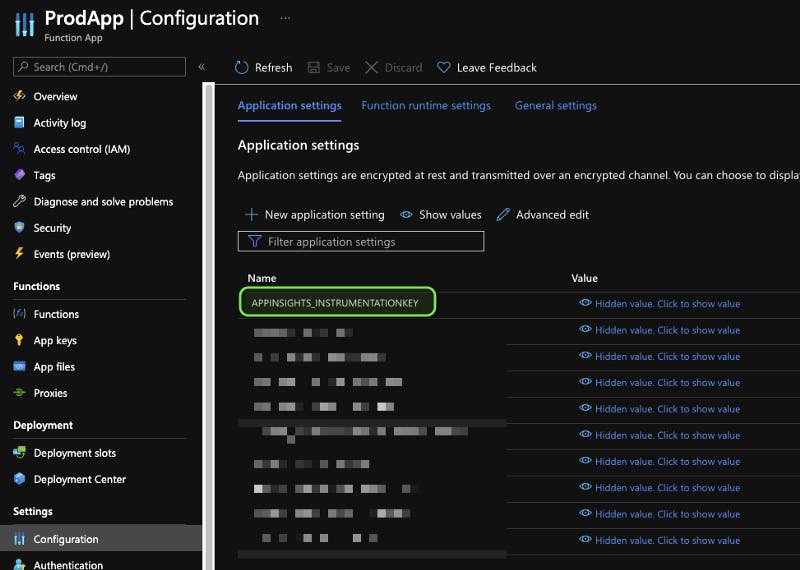
I renamed mine to APP_INSIGHTS_KEY . Don't forget to save the settings. After that, Application Insights will be disabled for the Function App which you can see in the Application Insights section.
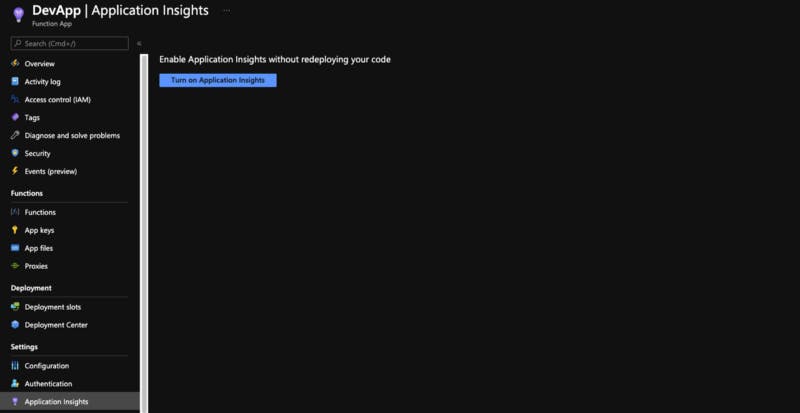
Note*: Toggling the Enabled button in the Application Insights section will not work. You have to rename or remove the App setting for Application Insights to be disabled.*
Step 2: Install Application Insights SDK
I'm using Node.js for our Azure Functions, so installing the SDK is as simple as executing npm install -S applicationinsights . The installation might differ if you're not using Node.js. Follow the Microsoft Docs to get started for the Language you're using.
Step 3: Setup Application Insights SDK
There are a couple ways to set this up. The way I did it is the simplest, if you have a lot of Functions and requires the least amount of code change.
This is the initial folder structure:
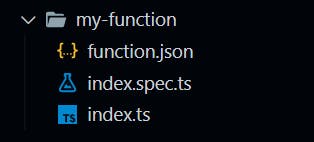
Pretty standard. index.ts contains the Function code and index.spec.ts contains the unit tests. Now, if you look at the “Azure Function Example” in the GitHub repo for the Application Insights Node.js SDK, you'll notice that those changes would a) be a nightmare to do for multiple Functions and b) would mean that we can no longer easily test our Function code. Also, maintaining the config for the Application Insights SDK in multiple places would definitely not be DRY 😉
So I ended up writing a wrapper that I could just pass my Function into.
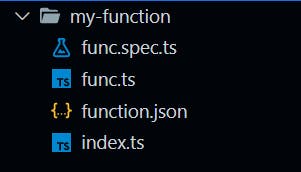
I renamed the index.ts to func.ts and added a new index.ts. Don't forget to update the imports.
I can also tell you from experience, that you don't want to try naming them function.ts so you don't spend an hour debugging your tests. You can probably figure out why.
So the folder structure now looks like this:
I wrote two wrappers. One for HTTP triggered Functions and one for the rest of the triggers. I added comments so you can just check out the code below:
// Wrapper for Functions that use the HTTP Trigger

import { AzureFunction, Context, HttpRequest } from '@azure/functions';
import * as appInsights from 'applicationinsights';
import { SeverityLevel } from 'applicationinsights/out/Declarations/Contracts';

appInsights
  // don't forget to set this!
  .setup(process.env.APP_INSIGHTS_KEY)
  .setAutoDependencyCorrelation(true)
  .setAutoCollectRequests(true)
  .setAutoCollectPerformance(false, false)
  .setAutoCollectExceptions(true)
  .setAutoCollectDependencies(false)
  .setAutoCollectConsole(true)
  .setUseDiskRetryCaching(false)
  .setSendLiveMetrics(false)
  .setDistributedTracingMode(appInsights.DistributedTracingModes.AI_AND_W3C)
  .setAutoCollectHeartbeat(false);

appInsights.defaultClient.setAutoPopulateAzureProperties(true);
appInsights.start();

export default function createAppInsightsWrapperForHttpTrigger<T extends Function>(func: T) {
  return async (ctx: any, req: any, ...args: any[]) => {
    const correlationContext = appInsights.startOperation(ctx, req)!;

    return appInsights.wrapWithCorrelationContext(async () => {
      const start = Date.now();

      try {
        await func(ctx, req, ...args);

        appInsights.defaultClient.trackRequest({
          name: `${req.method} ${req.url}`,
          resultCode: ctx.res!.status,
          success: ctx.res!.status < 400,
          url: req.url,
          duration: Date.now() - start,
          id: correlationContext.operation.parentId,
          properties: ctx.res!.status >= 400 ? ctx.res!.body : undefined,
        });
      } catch (error) {
        ctx.res = {
          status: 500,
          body: { error: 'Internal Server Error' },
        };

        appInsights.defaultClient.trackRequest({
          name: `${req.method} ${req.url}`,
          resultCode: 500,
          success: false,
          url: req.url,
          duration: Date.now() - start,
          id: correlationContext.operation.parentId,
          properties: { error: (error as Error).message },
        });
      }

      appInsights.defaultClient.flush();
    }, correlationContext)();
  };
}
// Wrapper for Functions that don't use HTTP Triggers

import { AzureFunction, Context } from '@azure/functions';
import * as appInsights from 'applicationinsights';
import { SeverityLevel } from 'applicationinsights/out/Declarations/Contracts';

appInsights
  // don't forget to set this!
  .setup(process.env.APP_INSIGHTS_KEY)
  .setAutoDependencyCorrelation(true)
  .setAutoCollectRequests(true)
  .setAutoCollectPerformance(false, false)
  .setAutoCollectExceptions(true)
  .setAutoCollectDependencies(false)
  .setAutoCollectConsole(true)
  .setUseDiskRetryCaching(false)
  .setSendLiveMetrics(false)
  .setDistributedTracingMode(appInsights.DistributedTracingModes.AI_AND_W3C)
  .setAutoCollectHeartbeat(false);

appInsights.defaultClient.setAutoPopulateAzureProperties(true);
appInsights.start();

// this might not work for *every* trigger, but it will work for most
export default function createAppInsightsWrapper<T extends Function>(func: T) {
  return (ctx: any, ...args: any[]) => {
    const correlationContext = appInsights.startOperation(ctx as any, ctx.executionContext.functionName)!;

    return appInsights.wrapWithCorrelationContext(async () => {
      const start = Date.now();

      try {
        await func(ctx, ...args);

        appInsights.defaultClient.trackRequest({
          name: ctx.executionContext.functionName,
          resultCode: 200,
          success: true,
          url: ctx.executionContext.functionName,
          duration: Date.now() - start,
          id: correlationContext.operation.parentId,
        });
      } catch (error) {
        appInsights.defaultClient.trackRequest({
          name: ctx.executionContext.functionName,
          resultCode: 500,
          success: false,
          url: ctx.executionContext.functionName,
          duration: Date.now() - start,
          id: correlationContext.operation.parentId,
          properties: { error: (error as Error).message },
        });
      }

      appInsights.defaultClient.flush();
    }, correlationContext)();
  };
}
With the wrapper in place, we just need to populate each index.ts file with the same code and we're done. Keep in mind that you have full control over how the wrapper looks and what you enable or disable in the Application Insights SDK.
This is what the index.ts now looks like:
import createAppInsightsWrapper from '../utils/app-insights';
import httpTrigger from './func';

export default createAppInsightsWrapper(httpTrigger);
That's it. If you deploy your Function App, you can see the changes in action.
The amount of ingested data in my app is now so little, that I'll have to show another chart to actually see how much it is:
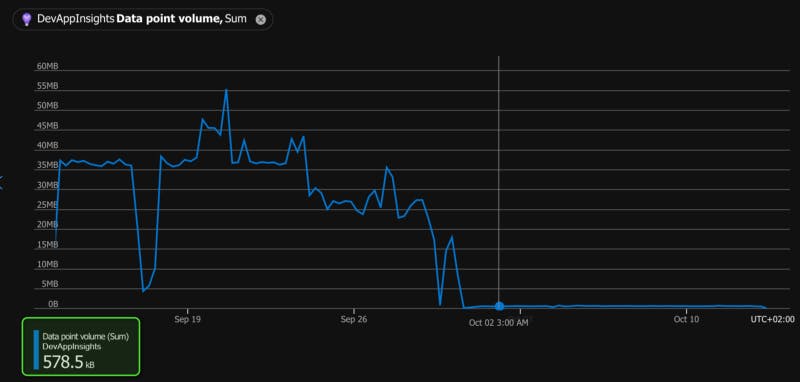
Only about 600KB per day 😲🥳
One might get the impression that there's a lot of metrics missing (or that it's not working). But so far, I haven't noticed any missing metrics.
Final Thoughts
Using the Application Insights SDK sounded scary at first, but I think my wrapper turned out quite well. Now, all of this obviously depends on your needs (and budget). In my case, the application is very much driven by cost. The cost for Application Insights as it is just doesn't fit in my budget. Maybe you might be able to get away with what can be configured in the host.json file.
I hope you enjoyed this post. If you have suggestions or questions, hit me up! Cheers!
If you want, you can follow me on twitter: https://twitter.com/byrln
This article was originally posted on medium.com
Resources
- https://docs.microsoft.com/en-us/azure/azure-monitor/app/app-insights-overview
- https://docs.microsoft.com/en-us/azure/azure-monitor/app/azure-web-apps
- https://docs.microsoft.com/en-us/azure/azure-functions/functions-host-json
- https://docs.microsoft.com/en-us/azure/azure-monitor/app/api-custom-events-metrics
- https://www.gustavwengel.dk/application-insights-costs-lots-of-money
- https://github.com/microsoft/ApplicationInsights-node.js